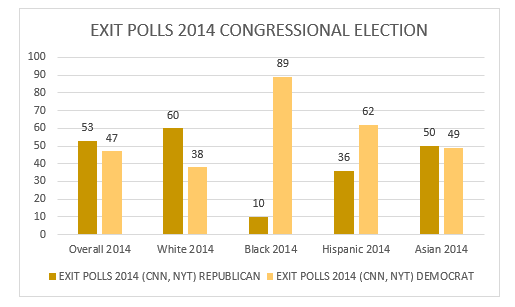
The Congress 2018 column I published in early April looked at how the Democrats and Republicans are doing in the race for Congress this fall through a question entitled the National Generic Congressional Ballot: Are you planning to vote Democrat or Republican for the House of Representatives this fall? The column compared the results of four late March 2018 polls to the Results of Exit Polls for the last non-Presidential election year race for Congress, 2014. The 2014 Election Exit Poll reported that Americans who voted in House elections that year voted 53% Republican to 47% Democratic in a straight-match-up between the two parties.
The four late March 2018 polls, from Quinnipiac, The Economist, Marist, and Fox News, showed 5-6 point leads for the Democrats, with about 15% of the electorate still undecided or claiming they would vote for another political party. If the undecideds broke in the same proportion as those voters making a choice at that time, the Democrats would be close to a seven-point lead.
Nate Silver, the national polling analyst who founded fivethirtyeight.com, an online publication focused on politics and polling, has said the Democrats need to win the National Congressional vote by seven full percentage points against the Republicans (in the results, not just the polls!) to have a break even chance of taking the majority in the House of Representatives, given the distribution of the electorate across the country among the individual 435 districts. That’s what I call the ” 7% ” solution.
The Democrats still hold a lead in early May 2018 polls on the National Generic Congressional ballot question, but it’s smaller. (The National Generic Congressional ballot question, by the way, and most other polls are updated on a daily basis on the fivethirtyeight website. )
As we all know, polls are uncertain animals and a look at these early May polls exposes some of the shortcomings of polling, but still demonstrates the potential for a Democratic victory, much of which will ultimately depend on the intensity of the campaigns in the individual districts. The starting point for analysis remains a comparison with what happened in 2014, and then moving on to the new polls.The 2014 Exit Polls showed the following results:
The four early May Congressional ballot polls show the Democrats with two five-point leads one three point lead, and one with six points*. This graph compares these results with the 2014 Exit Polls.
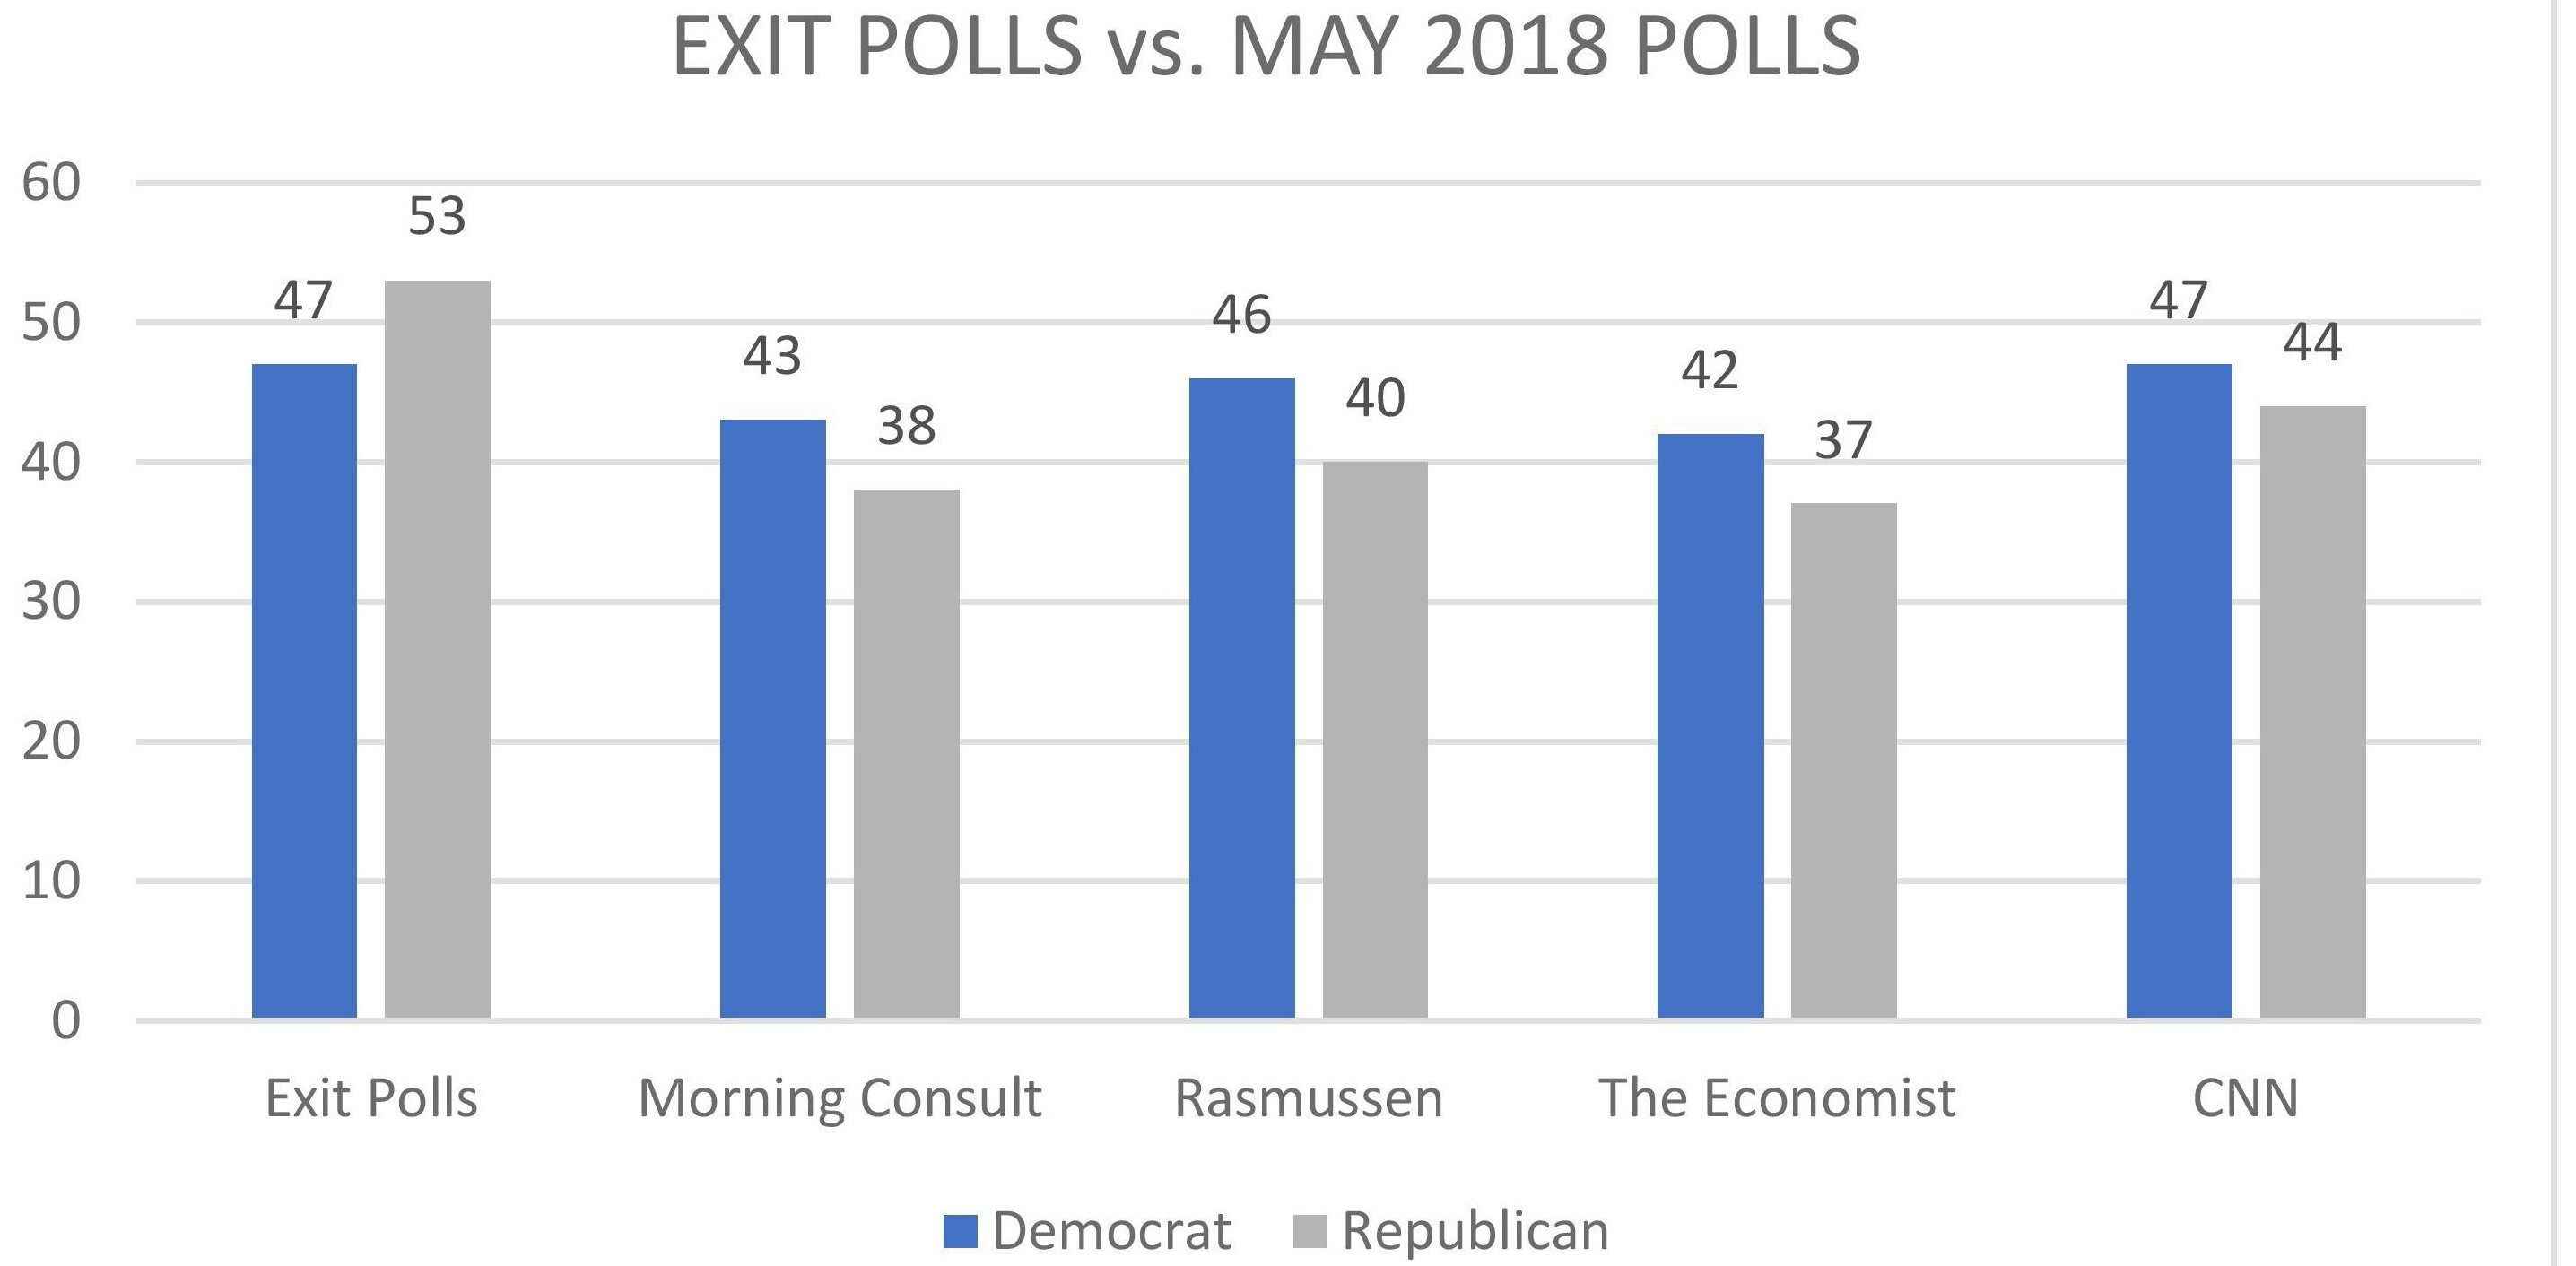
CNN claimed that its poll, with the Democrats holding a small three point lead, showed the Republicans were closing the gap from 2017, when many polls were showing the Democrats with leads of ten points or more. Two other polls, Morning Consult and The Economist/You Gov, show five-point leads for the Democrats. The Rasmussen six-point Democratic lead is interesting because Rasmussen polls a different segment of the electorate, likely voters, compared to the others, which poll all registered voters. Likely voters are defined as a group with a regular voting history in non-Presidential year elections. Rasmussen also uses this group for its Daily Presidential approval rating, which has shown Trump sometimes at 50% approval, higher than virtually all other polls. One explanation for this apparent contradiction is that voters may be frequently responding with approval for a specific Trump action, which may get reflected in the bumps up and down of the daily ratings, but still seek a check on him with a Democratic Congress.
This next graph compares a breakdown of Exit Polls for white voters with the new May 2018 polls for white voters: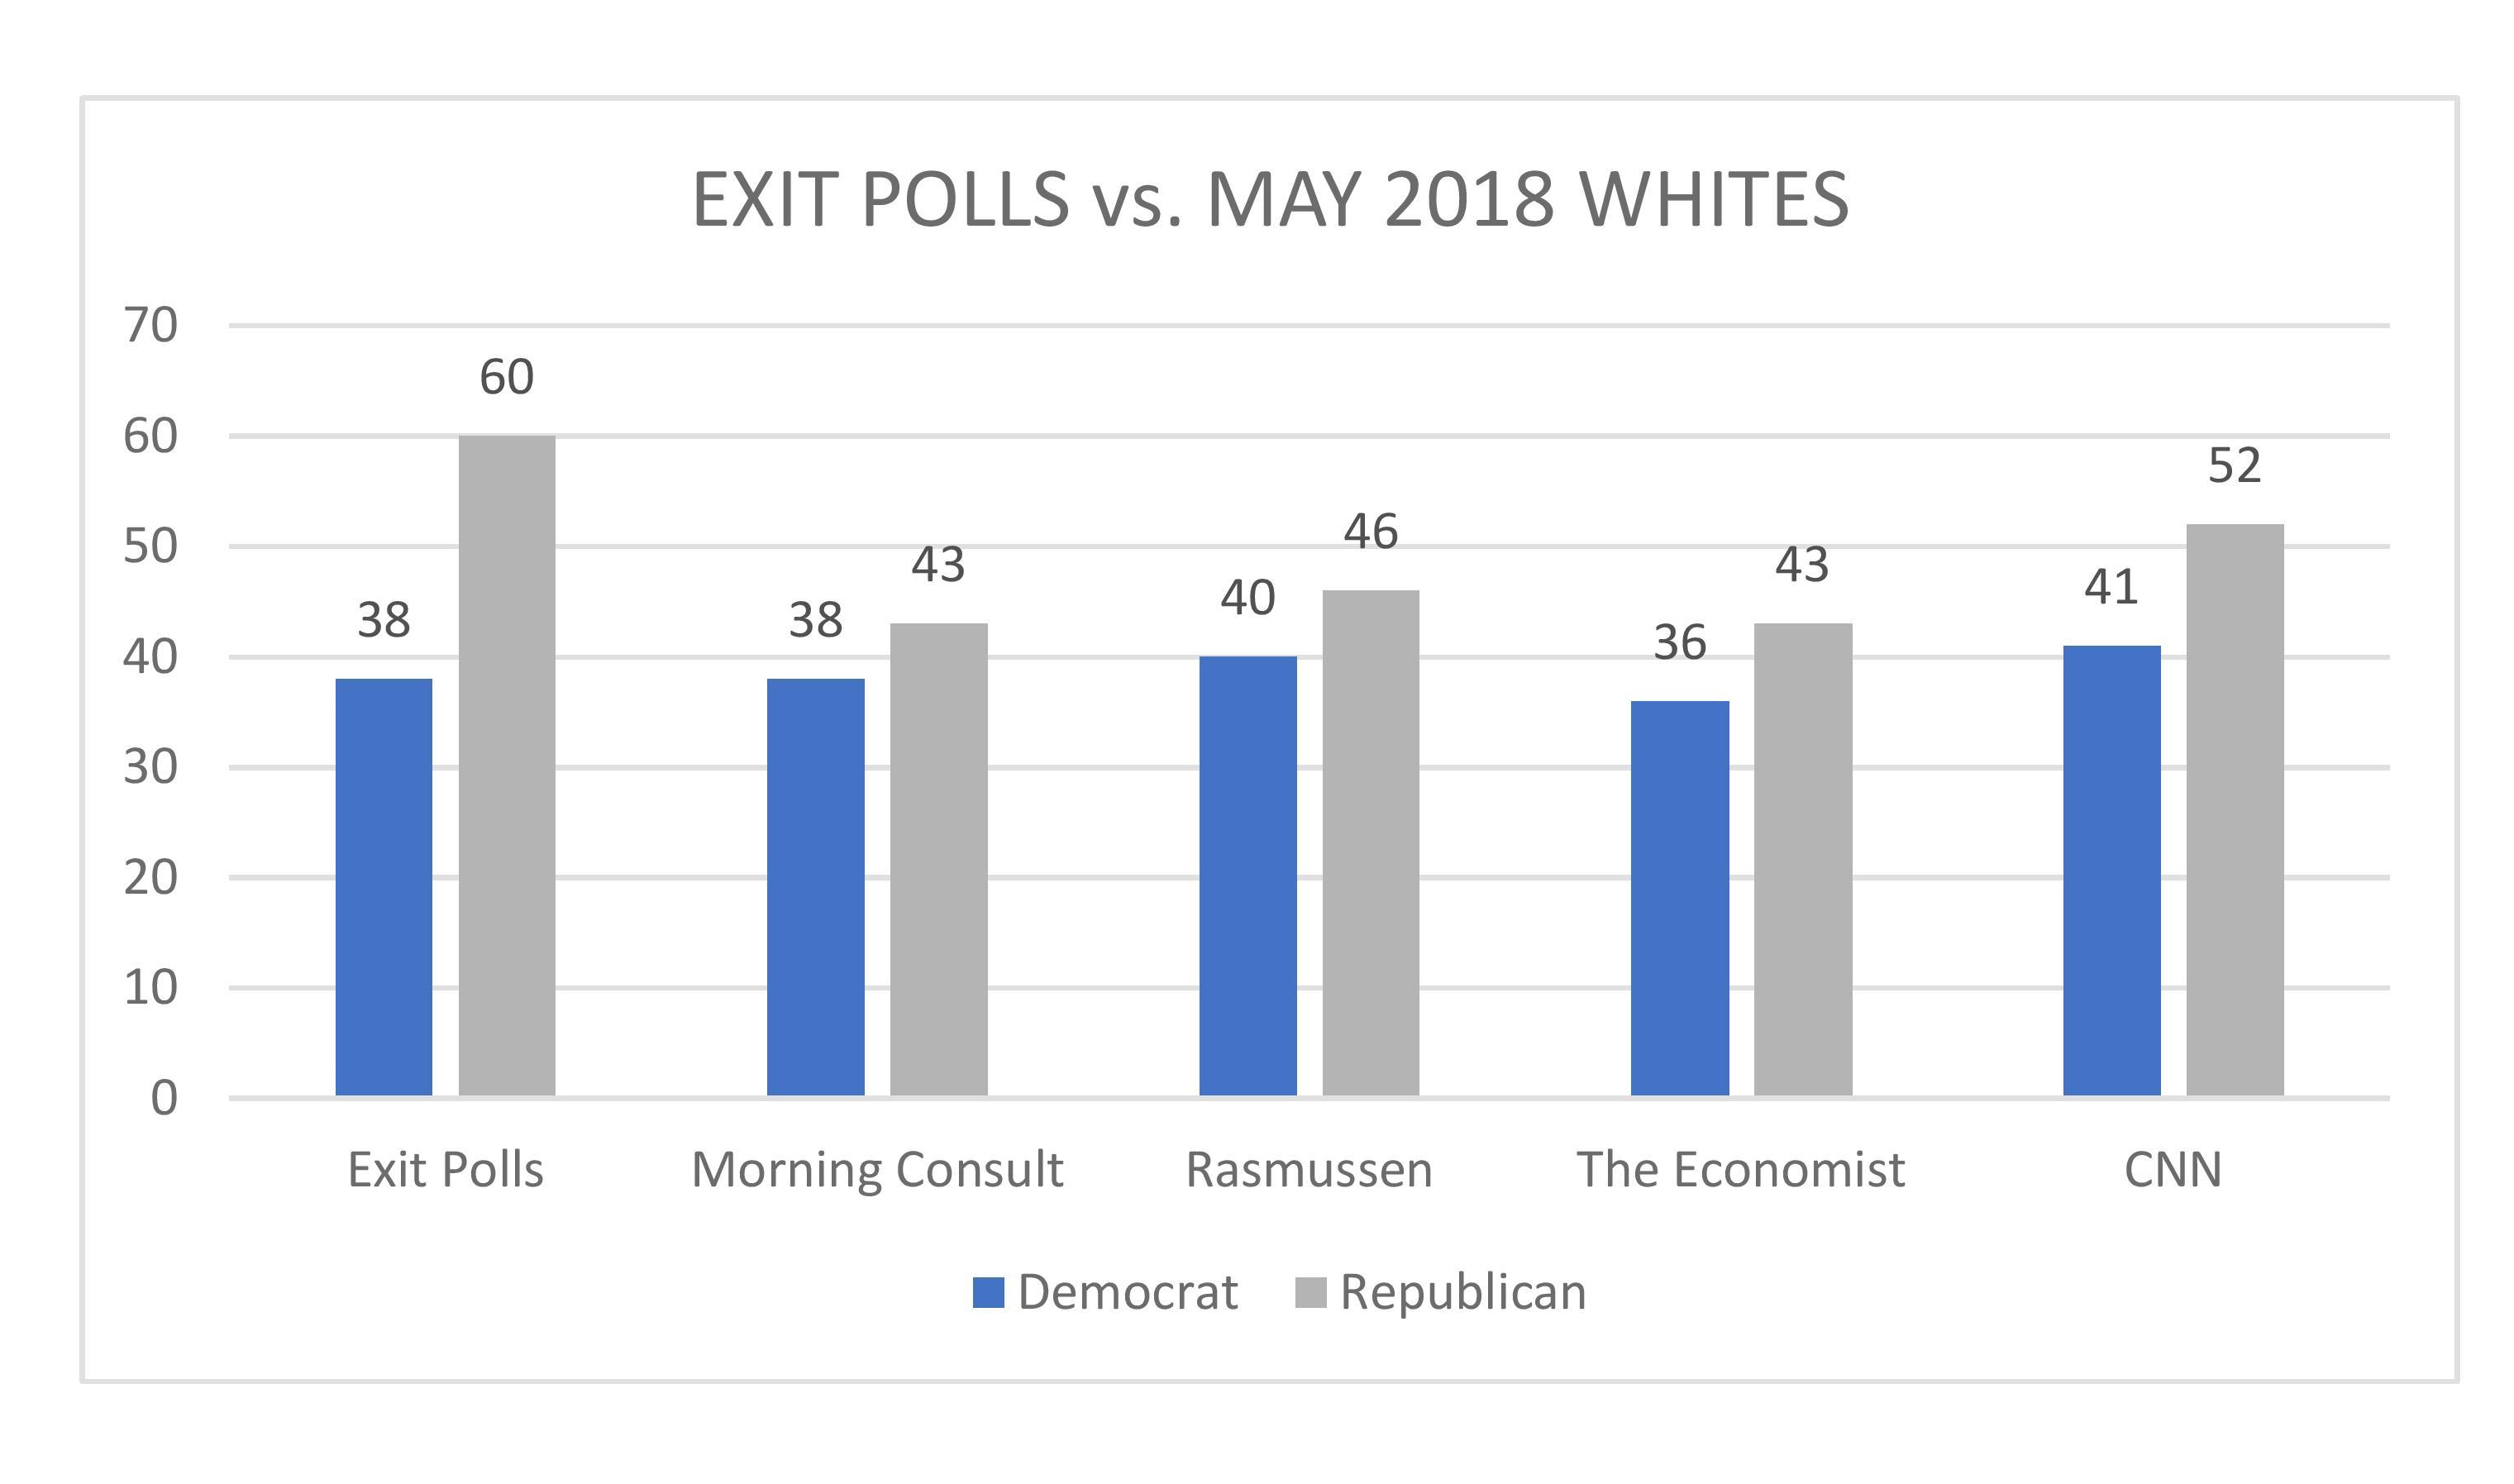
The Democrats lost the white vote 60-38 in 2014, according to the Exit Polls. The May 2018 Polls remain similar to the March 2018 polls- the four May polls show the Democrats holding an average of 39%, similar to how they did in 2014, while Republicans in the four polls average 46% among whites. The remainder are undecided or claim they would vote for another party. If the undecideds broke in the same proportion as the samples making choices now, the Democrats could reach 44% of the white vote, substantially better than they did in 2014.
The next graph compares Exit 2014 Polls for black voters with the results of three of the four May polls for black voters. CNN consolidated polling results for non-white voters and is shown in the graph.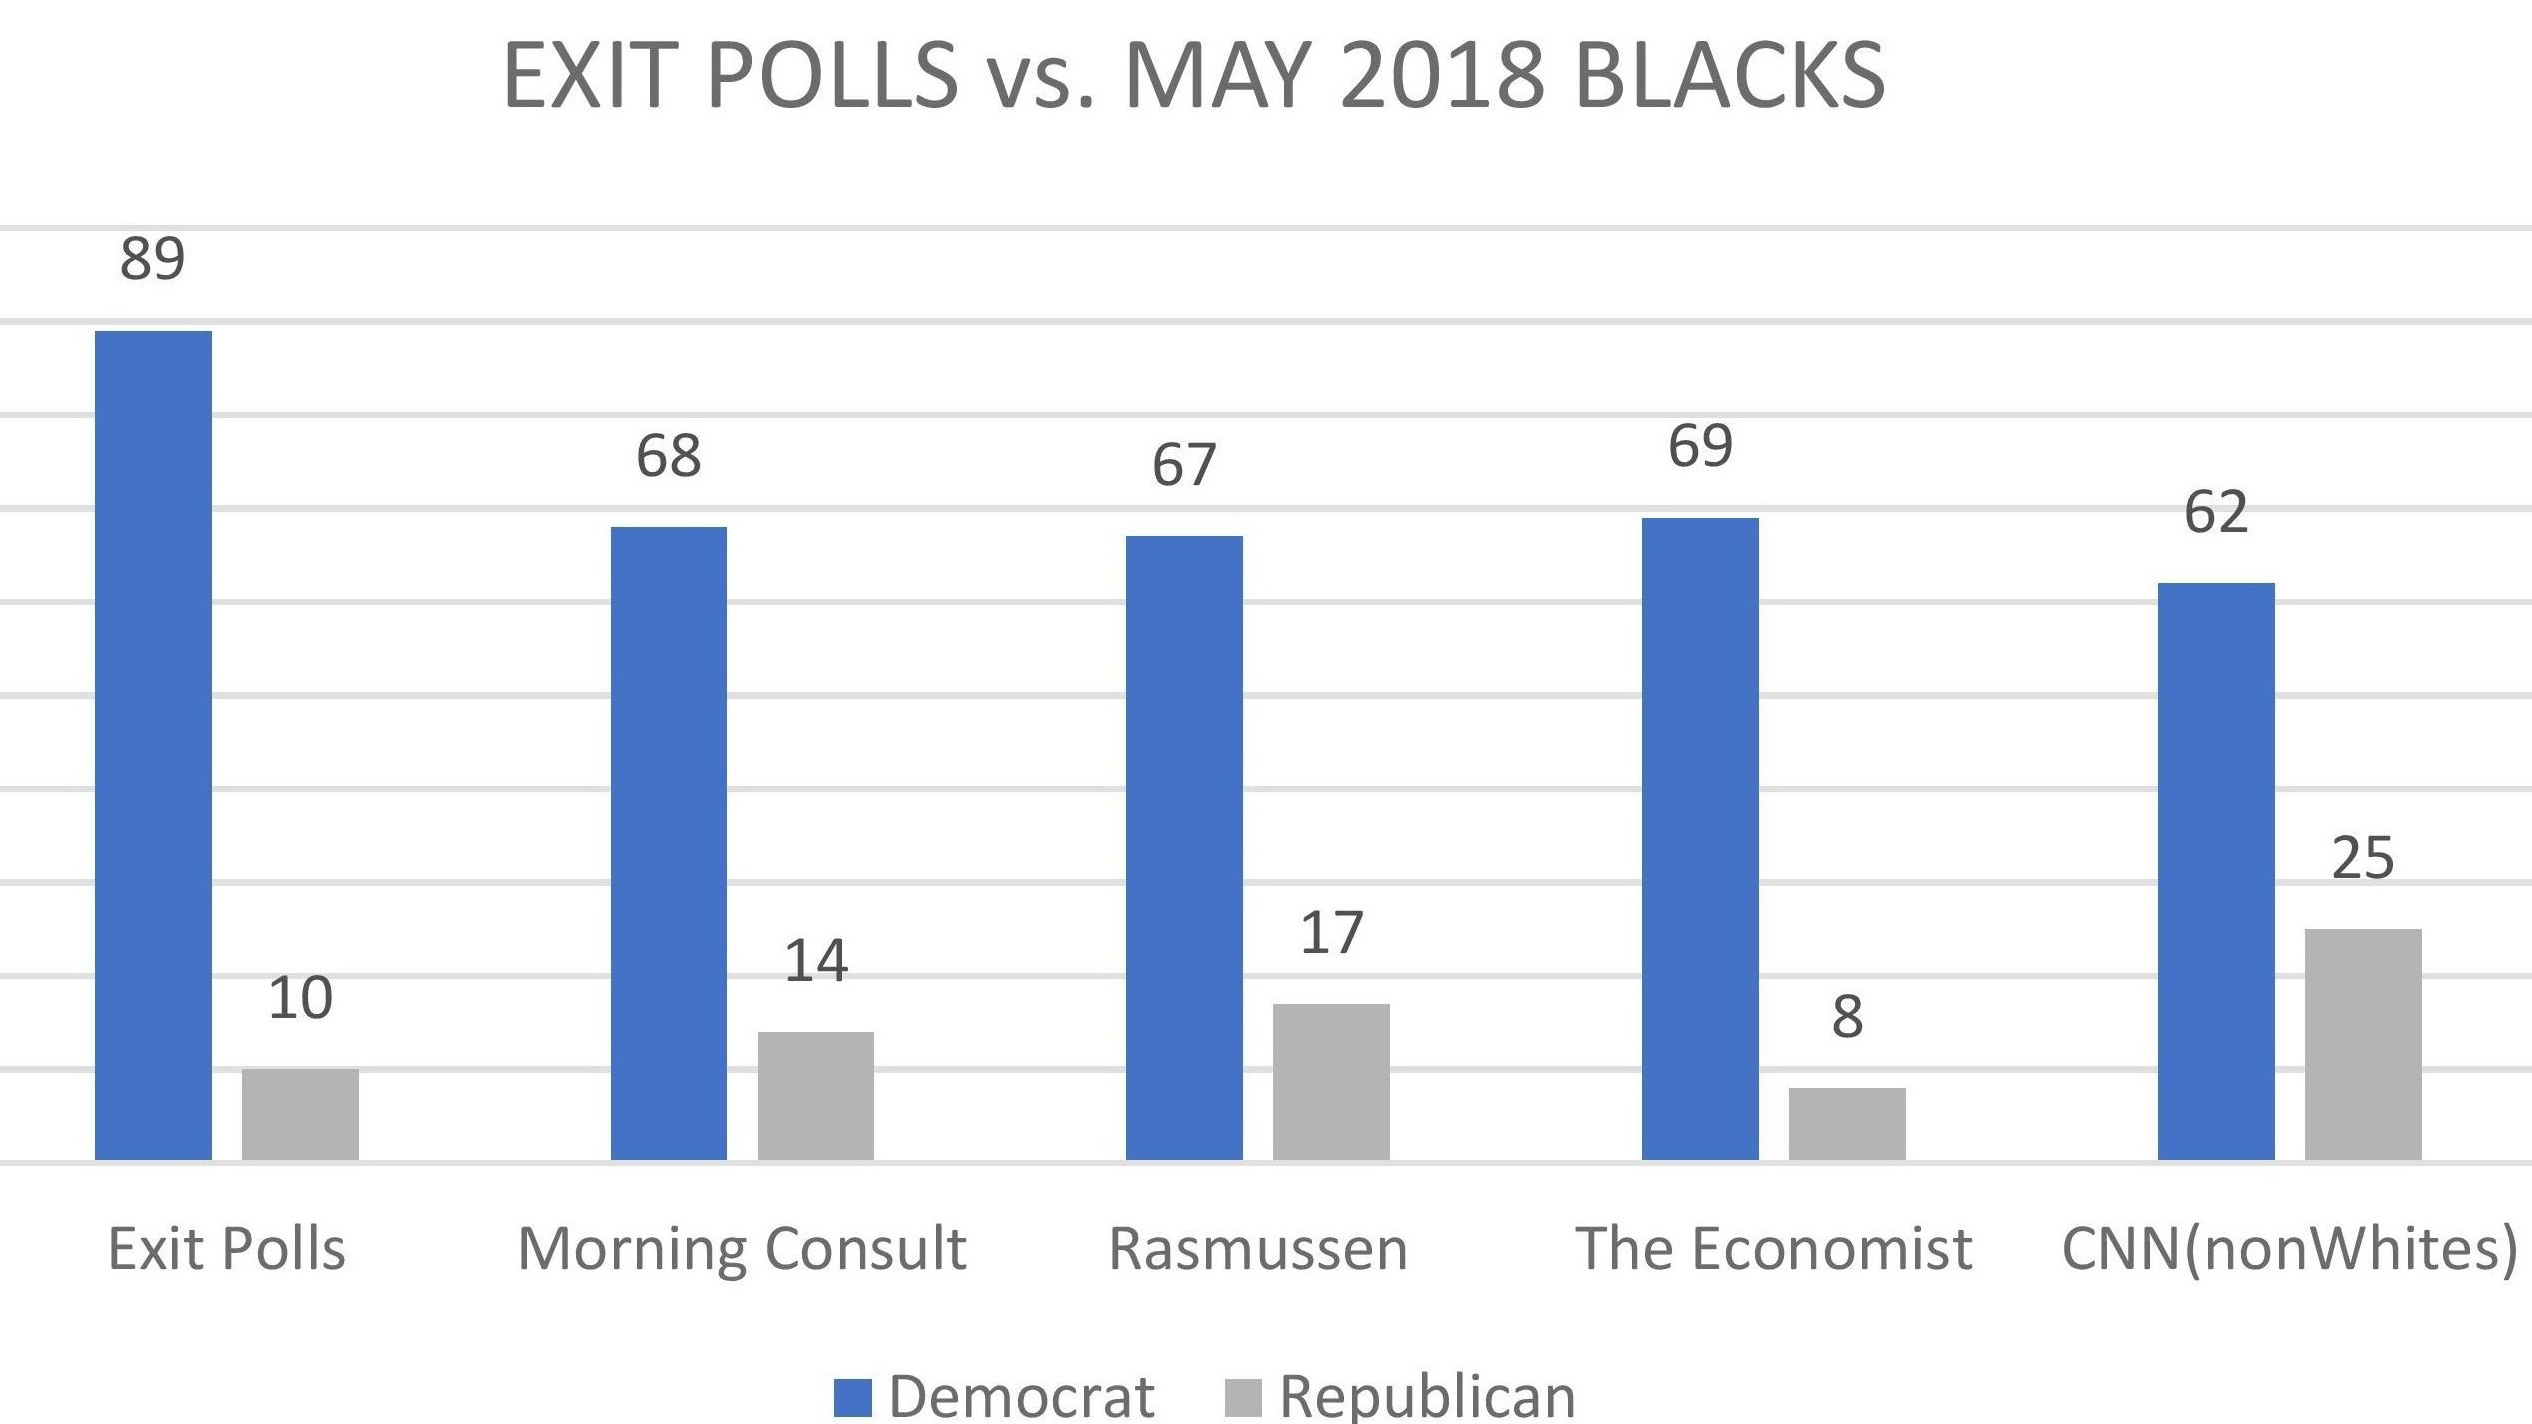
The May 2018 polls for black voters show similar huge margins supporting the Democrats as 2014, although 2 out of 3 of the polls show slight improvements for the Republicans. Interpreting the results is difficult when polls reach only a few members of a group that is smaller than the sample as a whole. A poll of 1000 voters might have 120 black voters – similar to their share of the electorate- but a small sample of 120 could have a margin of error of +- 10, meaning the result of the poll compared to the real population of that particular group could be ten points higher or lower than the result of the poll. The prior results from 3 March polls for black voters were 83-7, 73-15, and 86-6, with the lopsided margins for the Democrats. Volatility in poll results for small samples demonstrates some of the limitations of polling.
Here are the results of the four May polls for Hispanics and/or nonwhites.
Only two of the four May 2018 polls separate Hispanics in the electorate; the other two group either group all nonwhites together or group Hispanics with other nonwhites except blacks. All four show the Democrats holding substantial leads among Hispanics and among nonwhite voters in general, within range of the 2014 results, but once again these results come from smaller samples. Three March polls among Hispanics had results of 64-30, 46-23, and 43-31, somewhat similar to the May polls. Regardless of these poll results, Hispanics were only a 7% share of the electorate in 2014- Democrats must boost the number of Hispanic voters substantially in 2018 to improve their chances of winning a majority, as well as win a share of their vote similar to 2014. Hispanics were 11% of the electorate in the Presidential election, compared to 7% in 2014.
*- Three of the polls reported updates on May 23rd. The Economist reported a Democratic margin of 5 again, 43-38. Morning Consult reported a 6 point lead for the Democrats, 42-36, while the lead for Democrats in Rasmussen closed to one point, 43-42.
The Democrats maintain a small lead in the National Generic Congressional Ballot, but a large share of the population remains unsure of who they will vote for. Right now it seems that if the undecideds broke in the same proportion as those who had made choices in these polls, the Democrats would not quite gain the seven point margin. But the volatility of the Black, Hispanic, and other minority group poll results create some uncertainty in the direction of the polls. The Democrats are competing heavily in many more districts this year than they were in 2014, and still have an intensity that should increase their turnout.
Jim, thanks for this. There is one factor that is favorable to Democrats and that could help Republicans that are worth noting. For Democrats the significant increase in interest and turnout among blacks and young people could be vitally important. A strong economy, even with continued growth in inequality and wage stagnation favors Republicans. Marvin