
During the Trump second term, Americans can expect another onslaught of lies, far more than any fact checker could handle. On some basics about the economy, like jobs, inflation, food prices, gas prices, and oil production, having a reference guide for the past twelve years could come in handy.
And so, here it is:
Jobs – Obama, Trump, Biden 2013 to 2024
In the second term of the Obama administration, from Jan. 2013 to Jan. 2017, the American economy created 10.37 million jobs, almost 2.6 million per year.
In Trump’s first term, from January 2017 to February 2020, before employment began declining due to the pandemic, the American economy created 6.67 million jobs, about 2.13 million a year for the three years plus one month, February 2020.
From February 2020 to January 2021, under Trump, the economy lost almost 9.4 million jobs in the pandemic, including a loss of more than 20 million at a low point in April 2020. Overall, the economy lost 2.7 million jobs under Trump.
From January 2021 to November 2024 the economy created 16.37 million jobs under President Biden, including 11.8 million in the first two years. Here are the U.S. Bureau of Labor Statistics jobs numbers from 2013 to 2024:
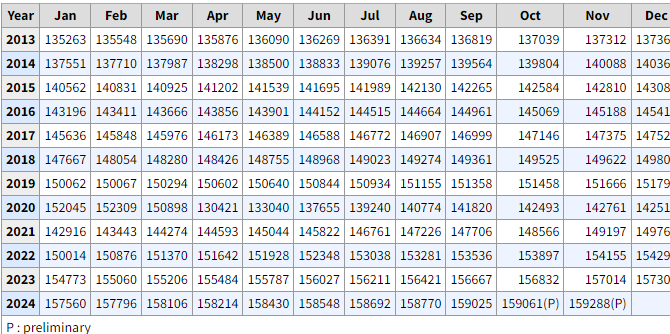
Under President Biden, job growth averaged 350,000 a month,but slowed beginning in January 2023 to November 2024 to 200,000 a month.
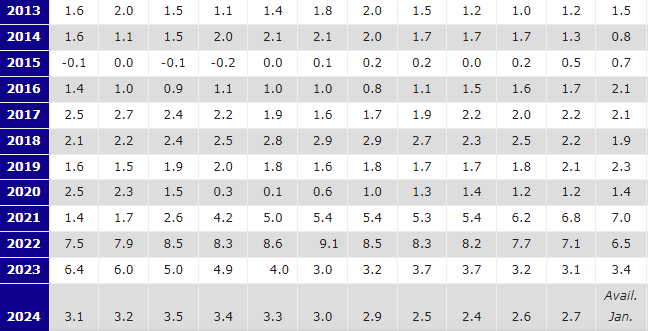
Inflation – Obama, Trump, Biden
The year- over- year inflation rates can be seen in the final column for December of each year. The CPI –Index (Consumer Price Index) in the first year of Obama’s second term, in December 2013, showed 1.5% inflation. Trump’s years had inflation at 2.1% in 2017, 1.9% in 2018, 2.3% in 2019, and 1.4% in 2020, the pandemic year. Under President Biden, in 2021, the COVID recovery year, inflation was 7.0%. In 2022, the year of the Russian invasion of Ukraine, inflation was 6.5%. In 2023 inflation was 3.4%, and as of November 2024 year– over– year inflation is 2.7%.
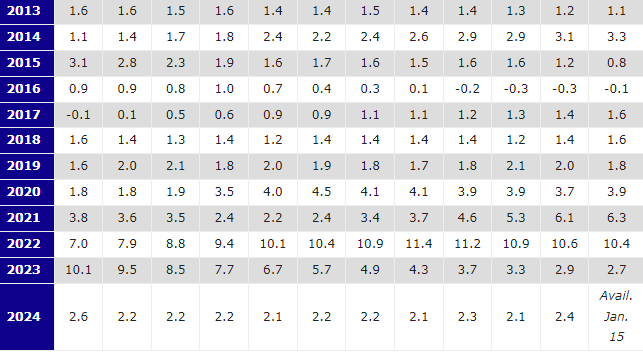
Food Price Inflation – Obama, Trump, Biden
The final column of each year is December, and that is where you can see the year-over-year price increase. In the first three years of Trump, food price inflation ran 1.6-1.8% a year, but in 2020, despite low overall inflation, food prices rose 3.9%. During President Biden’s term, food price inflation peaked at over 10% in 2022. In 2023 through November 2024, it calmed down to 2.7% and 2.4%. Overall, food price inflation has been over 23% during Biden’s four years.
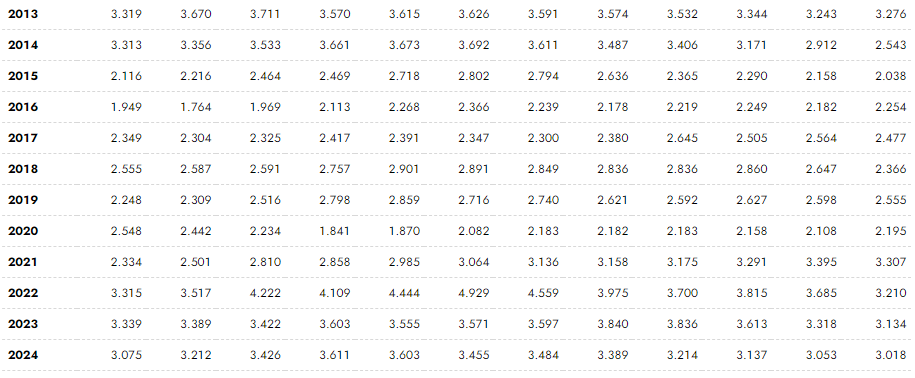
Retail Gasoline Prices – Obama, Trump, Biden
Below is a table of monthly retail regular gasoline prices in the United States from 2013 to the present from the United States Energy Information Administration. In November 2019, shortly before the pandemic and three years into the Trump administration, the price was about $2.60/gallon, and in November 2024 it was $3.05/gallon, a 17 ½% increase. Inflation over the five year period has been about 21%, so adjusted for inflation the prices are comparable, actually slightly below the overall rate of inflation. The United States government does not control the price of oil, which is set by the OPEC international cartel, is volatile and affected by the risks of supply interruptions and broad international supply and demand events.
Domestic Crude Oil Production – Obama, Trump, Biden
The table below, from the U.S. Energy Information Adminstration, shows U.S. domestic oil production beginning in 2016, Obama’s last year. Peak production in the Trump years was November 2019, at 12.99 million barrels/day. Production dropped as low as 9.7 million barrels a day in May 2020, the trough of the pandemic. Production is now at all-time highs, with a national peak in the Biden years in October 2024 of 13.457 million barrels/day.
Crime – Obama, Trump, Biden
The table below shows US violent crimes, by the number and the rate per 100,000 of U.S. population, from 2013 to 2023. Column 4 shows the overall rate of violent crime, ranging in the Obama years from about 370 per 100,000 population in 2013 to nearly 387/100,000 in 2016. Homicides soared 30% in the first year of the pandemic while Trump was President, from nearly 17,000 to more than 22,000. Aggravated assault (felony assault) jumped from 813,000 to 915,000.
In 2021, the FBI changed its reporting system for crime and some police departments failed to make timely filings. As a result, the 2021 overall violent crime rate may not be accurate. Violent crime began dropping in 2022 from 2020 and by 2023 was about the same rate as 2019, 363.8 per 100,000 versus 364.4 per 100,000.
Yr. Pop. V.Cr. Rte. Hom. Rte Rape* Rte Rape*Rte Robb. Rte. Ag.Ast Rt.
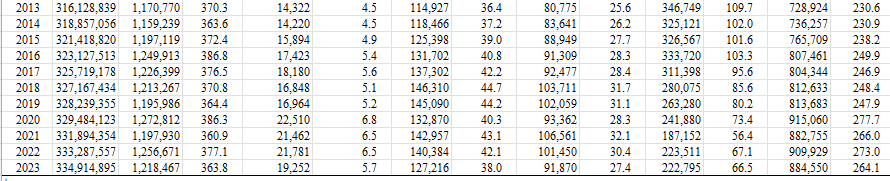
Source: FBI
- The above table has two classifications for the crime of rape, one used under an older definition of the crime, and for a newer definition of the crime.
First Six Months of 2024
On September 30, 2024, the FBI’s Uniform Crime Reporting (UCR) Program released the Quarterly Uniform Crime Report (Q2), January-June 2024, on the FBI’s Crime Data Explorer (CDE).
A comparison of data from agencies that voluntarily submitted at least three or more common months of data for January through June 2023 and 2024 indicates reported violent crime decreased by 10.3%. Murder decreased by 22.7%, rape decreased by 17.7%, robbery decreased by 13.6%, and aggravated assault decreased by 8.1%. Reported property crime also decreased by 13.1%.
The data indicate generally that, as of the first six months of 2024, crime has fallen back to the level of 2019, the year before the pandemic while Trump was president. In other words, overall violent crime in the U.S. as of 2024 is now at the same level as when Trump was president. The graph below offers more historical context, showing violent crime from 1990 to 2023 per 100,000 population.
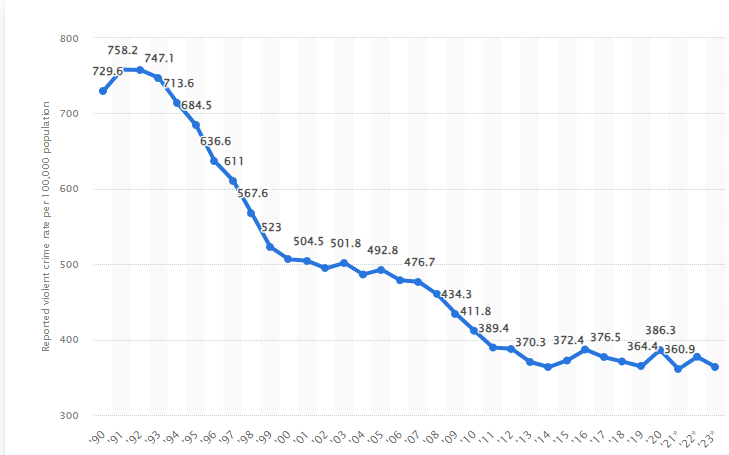
The graph shows that, despite the rise in violent crime that occurred in 2020, overall violent crime was higher before 2010 and earlier, and is half the rate per 100,000 population compared to the early nineteen-nineties. The violent crime rate was 363.8 per 100,000 in 2023, and the F.B.I. reported that violent crime fell 10% in the first six months of 2024 compared to the first six months of 2023.
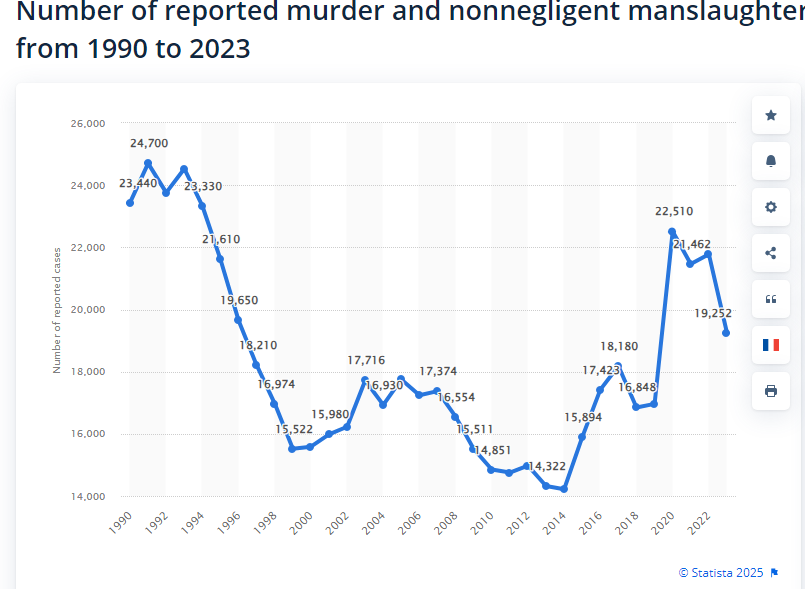
HOMICIDES IN THE UNITED STATES
Homicides in the United States rose 30% in 2020 from 2019 in the pandemic year in which Trump was president. The rate rose to 6.8/100,00 in 2020 from 5.2 per 100,000 in 2019, and dropped to 6.5/100,000 in 2021 and 2022 before declining more rapidly in 2023 and the first six months of 2024 ( noted above) to the 2019 level.
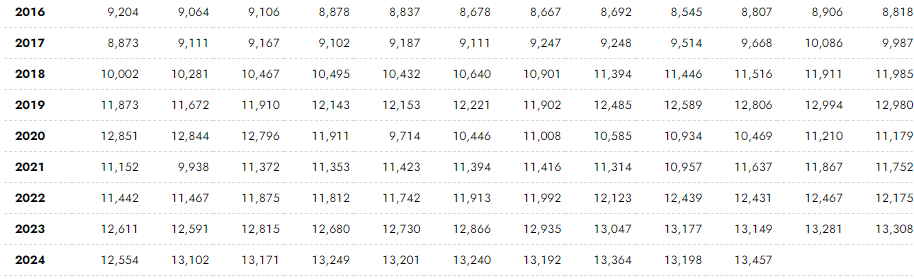
Manufacturing Jobs – Obama, Trump, Biden
The table below shows U.S. manufacturing jobs from 2013 to the present, November 2024. From January 2013 to January 2017, under President Obama, the U.S. gained about 380,000 manufacturing jobs. From January 2017 to February 2020, the final month before the pandemic, the U.S. gained about 400,000 manufacturing jobs while Trump was president, but by January 2021 had fallen 600,000 and was 200,000 below where Trump started in 2017.
Under President Biden, manufacturing gained about 780,000 jobs by January 2024, but this sector has fallen by about 80,000 through November and is now only about 100,000 jobs above Trump’s peak before the pandemic.

The Bottom Line – Stealing the Credit
I hope this handy “reference” blog will enable you to discern fact from fiction during Trump’s next presidency because he will obviously fill it with lies, half truths and disinformation.
Here’s the bottom line: By 2024, inflation has calmed down, domestic oil production is at an all-time high, manufacturing jobs are higher than when Trump was president, and violent crime and homicides have calmed back down to the same level as when Trump was President. The 2025 environment will reflect the lower economic and emotional stress levels associated with the improvements that have already occurred, for which Trump will claim credit. Trump will minimize the extent of his new tariffs to avoid driving up inflation and focus on deportations of criminals while his media machine begins claiming everything is great again.
In the meantime, the main goal will be big tax cuts for the rich and big business, and savage budget cuts for the poor.
It’s going to be a rough ride.
Discover more from Jim Brennan's Commentaries
Subscribe to get the latest posts sent to your email.
Thank you for this task! Will try to absorb and digest it for handy convo. Sadly, the people in my orbit who most need to know these facts will refuse to see them.
laura kramer
Immigrants subsidize Social Security by contributing, but not being able to get a Social Security check. Trump wants to deport these exploited workers, but how is he going to make up for
the lost income to the Social Security Trust Fund?
Great reporting Jim.